
Frequently Asked Questions (FAQ)
IM-AAM — The Investment Manager Powered by an Artificial Machine
1. What is IM-AAM?
IM-AAM is an AI-powered stock recommendation platform that identifies undervalued stocks with high potential for price appreciation. It combines fundamental valuation (DCF) with technical trend analysis to provide actionable buy and sell strategies.
2. How does IM-AAM select stocks?
Our system uses a dual approach:
-
- Fair Value Analysis (DCF)
We estimate the intrinsic value of a stock using Discounted Cash Flow models.
- Fair Value Analysis (DCF)
-
- Trend Confirmation
We analyze price trends, momentum indicators, and market structure to confirm timing.
- Trend Confirmation
 Only stocks that are undervalued AND in a favorable trend are selected.
3. What is the main strategy behind IM-AAM recommendations?
We follow a “Value Meets Momentum” strategy:
-
- Buy when:
-
- Price is below fair value (undervalued)
-
- Trend shows upward momentum or reversal signal
-
- Price is near support line
-
- Buy when:
-
- Sell when:
-
- Price approaches or exceeds fair value
-
- Trend weakens or reverses
-
- Price is near resistance line
-
- Sell when:
This ensures both risk control and profit optimization.
4. What types of stock recommendations are available?
We provide three categories:
1. Daily Trades
-
- Short-term opportunities
-
- Valid for 1 day
-
- Focus on momentum and quick price movement
2. Swing Trades
-
- Medium-term (days to weeks)
-
- Held until target price or catalyst (e.g., earnings call date)
- PRE – EARNING :
Buy the stock 1–4 days before its earnings announcement, with the expectation that the stock price may increase significantly following the earnings release. This strategy is designed to capture potential price momentum around the earnings event. - POST – EARNING :
Buy the stock 1–7 days after its earnings announcement, with the expectation that the stock price will continue to rise gradually over the following weeks. This strategy aims to benefit from sustained post-earnings momentum. We generally recommend selling the stock before the next earnings announcement. - Disclaimer: Stock prices can move unpredictably, especially around earnings announcements. While no investment strategy can guarantee future returns, our recommendations are backed by extensive research and data-driven analysis. We evaluate each stock’s intrinsic value using proprietary financial models and assess its price momentum through our Technical Analysis (TA) scoring system. By combining both Fundamental Analysis (FA) and Technical Analysis (TA), we aim to identify high-quality investment opportunities with favorable risk-reward potential based on historical data and quantitative analysis.
3. Bullish Position
-
- Long-term investments (up to 12 months)
-
- This strategy focuses on stocks that appear to be significantly undervalued based on our Fundamental Analysis (FA) model and exhibit a strong long-term upward trend according to our Technical Analysis (TA) scoring system. It is designed for investors seeking long-term capital appreciation rather than short-term trading opportunities
5. How are buy and sell prices determined?
Each recommendation includes:
-
- Buy Price Range → Based on support levels + valuation gap
-
- Target Price → Based on fair value (DCF)
-
- Stop Loss → Based on risk management and trend invalidation
This creates a structured and disciplined trading plan.
6. What makes IM-AAM different from other platforms?
Unlike traditional platforms:
-
- We combine AI + valuation + trend analysis
-
- Focus on probability-based opportunities
-
- Provide clear entry and exit strategies
-
- Use a data-driven, non-emotional approach
7. Who is IM-AAM for?
IM-AAM is designed for:
-
- Beginner investors
-
- Active traders
-
- Retail and institutional investors
-
- Anyone who wants data-backed stock decisions
8. How do I access stock recommendations?
Users can:
-
- Deposit funds into the platform
-
- Purchase stock recommendations individually
-
- Access insights via their dashboard
9. Is IM-AAM a brokerage?
No.
IM-AAM does not execute trades.
We provide research, insights, and strategies — you execute trades through your own broker.
10. What markets does IM-AAM cover?
Currently focused on:
-
- U.S. Stock Market (NYSE & NASDAQ)
Future expansion may include global markets.
11. How accurate are the recommendations?
No system guarantees 100% accuracy.
However, IM-AAM focuses on:
-
- Statistical edge
-
- Risk-reward optimization
-
- Consistent methodology
Our goal is long-term performance consistency, not short-term speculation.
12. What risk management principles are used?
We emphasize:
-
- Defined stop-loss levels
-
- Controlled entry zones
-
- Favorable risk-to-reward ratios
Capital preservation is a core priority.
13. Can beginners use IM-AAM?
Yes.
Each recommendation is designed to be:
-
- Simple to follow
-
- Clearly structured
-
- Actionable without deep technical knowledge
14. How often are recommendations updated?
-
- Daily trades: Updated daily
-
- Swing trades: Updated based on market conditions
-
- Long-term positions: Reviewed periodically
15. Why use DCF for valuation?
DCF helps determine the true intrinsic value of a company based on future cash flows.
This allows us to:
-
- Identify undervalued stocks
-
- Avoid overpaying
-
- Set realistic price targets
16. Is IM-AAM suitable for long-term investing?
Yes.
Our Bullish Position category is specifically designed for long-term investors seeking value-driven growth opportunities.
17. Do I need technical analysis knowledge?
No.
IM-AAM simplifies complex analysis into:
-
- Clear signals
-
- Defined price levels
-
- Structured strategies
18. What is the goal of IM-AAM?
To help investors:
-
- Make smarter decisions
-
- Reduce emotional trading
-
- Identify high-probability opportunities
-
- Achieve consistent returns over time
19. What is FA & TA score ?
FA Score refers to the Fundamental Analysis score, while TA Score refers to the Technical Analysis score.
20. How do you measure the FA score and TA score ?
-
- FA Score (Fundamental Analysis):
We evaluate a company’s financial health by analyzing its financial statements and calculating key financial ratios. Our algorithm then processes and combines these ratios into a single, comprehensive score known as the FA Score. - Technical Analysis (TA Score):
We evaluate a stock’s price movements by analyzing its chart using various technical indicators. Our algorithm then processes and combines these indicators into a single, comprehensive score known as the TA Score.
- FA Score (Fundamental Analysis):
20. Could you provide a direct email address or connect me with a representative?
You can reach us at [email protected]
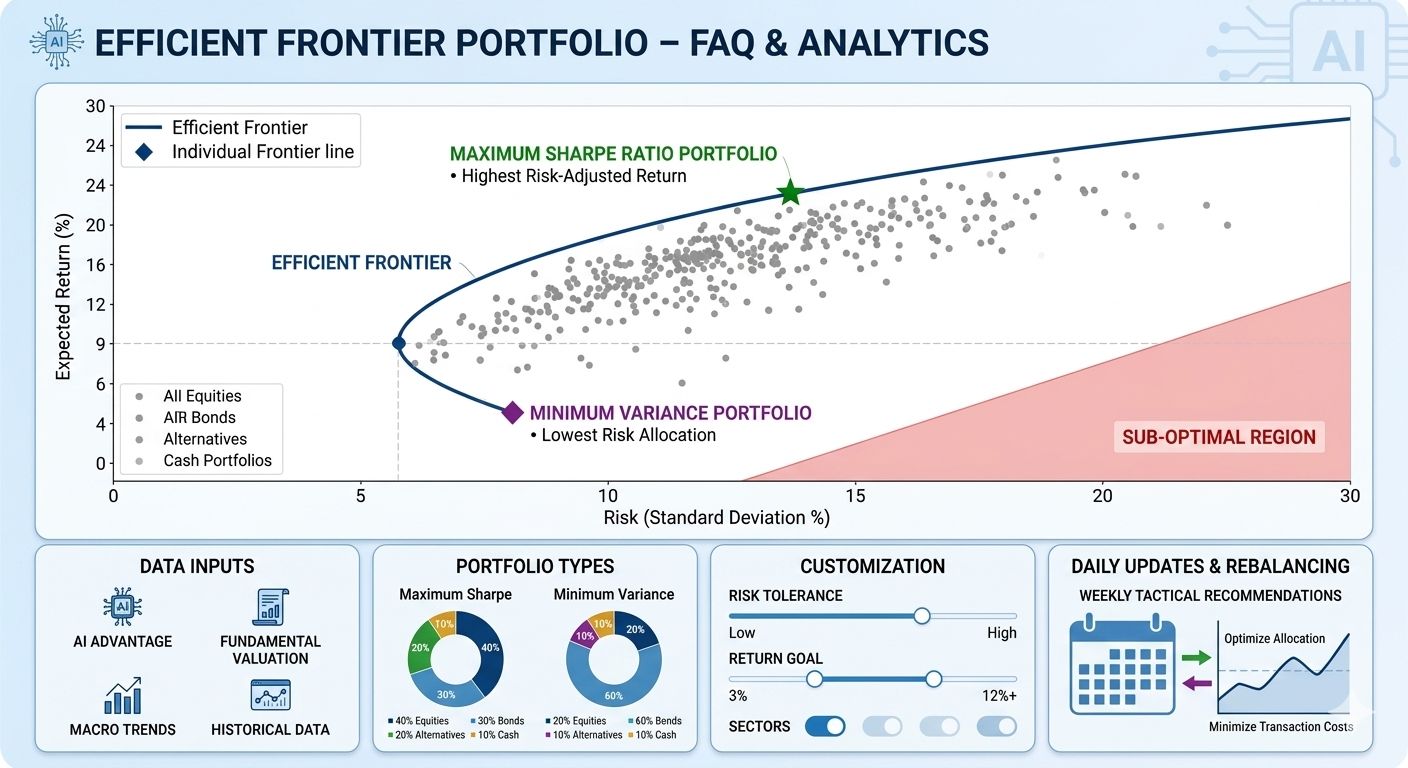
21. What is the Efficient Frontier?
The Efficient Frontier is a core concept in Modern Portfolio Theory (MPT). It represents a set of optimal portfolios that offer the highest expected return for a defined level of risk, or the lowest risk for a given level of expected return.
Portfolios that fall below the efficient frontier line are sub-optimal because they do not provide enough return for the amount of risk taken.
Traditional efficient frontier models rely strictly on historical performance data, which doesn’t always predict future market behavior.
IM-AAM enhances this process by using artificial intelligence to analyze fundamental valuations (like DCF models) and current macroeconomic trends. The AI adjusts the expected future returns and covariance matrix of assets, resulting in a forward-looking, dynamic Efficient Frontier rather than a purely backwards-looking one.
Because market volatilities and stock correlations shift constantly, IM-AAM recalculates the Efficient Frontier metrics daily based on the latest market closing prices and AI trend assessments. However, to minimize transaction costs, tactical rebalancing recommendations are typically suggested on a weekly or monthly basis depending on your settings.
You can use our pool filters to include specific sectors, cap sizes, or even individual ticker symbols. The AI will then instantly calculate the mathematical relationships between your chosen assets to display your personalized optimal asset allocation matrix.
22. Who can receive free stock recommendations?
Every newly registered user automatically receives a 7-day free trial. After the trial ends, users continue to receive a limited number of free recommendations each week.
23. How many free recommendations will I receive?
During your 7-day trial, you’ll receive 5 free recommendations:
- 2 Daily Trading
- 1 Swing Trading
- 2 Position Trading
After the trial, you’ll receive:
- 3 Daily Trading recommendations per week
- 1 Swing Trading recommendation per week
Please check here for more details
24. Who can receive free stock recommendations?
25. Why don’t I receive free Position Trading recommendations after the trial?
Position Trading recommendations require more extensive research and are designed for longer-term investment opportunities. After the trial, these recommendations can be unlocked by purchasing the individual stock.
26. Do I need a subscription?
No. IM-AAM does not require a monthly subscription. You only purchase the individual stock recommendations you want to unlock.
27. What happens after I purchase a stock recommendation?
The complete research becomes available in your account and is automatically added to My Portfolio for ongoing tracking and future updates. It may be remove from your ‘My Portfolio‘ after it has reached the target selling price point.
28. Does a recommendation guarantee a profit?
No. All investments involve risk. Every recommendation is generated using our proprietary research model, but past performance and analysis do not guarantee future returns.
29. How can I make money in the stock market?
Investors can potentially generate returns from stocks when the value of their investments increases over time. However, stock prices can also decline, and there is no guaranteed way to make money in the stock market.
At IM-AAM, we help simplify the research process by analyzing stocks using a combination of Fundamental Analysis (FA) and Technical Analysis (TA).
We look for stocks that may offer attractive opportunities by:
- Evaluating intrinsic value using financial models to identify potentially undervalued stocks.
- Analyzing financial health through financial statements and key financial ratios.
- Analyzing price movements and trends using technical indicators and our TA Score.
- Identifying different opportunities based on investment approaches, including Pre-Earning, Post-Earning, and Bullish Position strategies.
The goal is to provide data-driven stock research so investors can make more informed decisions about which stocks to consider, when to consider entering, and how to manage their positions.
IM-AAM does not guarantee profits or future stock performance. Investors should consider their own risk tolerance and conduct their own due diligence before making investment decisions.
30. How can I make money in the stock market?
There is no reliable or guaranteed way to make money easily in the stock market. Stock prices can rise or fall, and investors can lose money. A more systematic approach is to research companies, understand their valuation, consider market trends and risk, and build a diversified portfolio.
How IM-AAM can help: IM-AAM is designed to help investors research US-listed stocks using a combination of fundamental analysis, valuation, technical analysis, market data and portfolio analysis. Its Daily, Swing and Position strategies organize stock research according to different investment horizons.
31. How does stock investing work?
When you invest in a stock, you purchase an ownership interest in a publicly traded company. Your investment can increase or decrease in value as the market price changes. Some companies may also distribute dividends to shareholders.
Investors commonly evaluate a company’s business fundamentals, valuation, financial performance, growth prospects, market conditions and risk before making an investment decision.
How IM-AAM can help: IM-AAM combines multiple areas of stock research—including fundamental analysis, valuation and technical analysis—to help users investigate potential opportunities rather than relying on a single metric.
32. How do I choose a stock?
There is no single method that works for every investor. Common factors to consider include the company’s financial quality, valuation, growth prospects, market trend, volatility, risk and your own investment horizon.
A stock that looks attractive based on one factor may look less attractive when other factors are considered.
How IM-AAM can help: IM-AAM evaluates stocks using multiple factors across fundamental analysis, valuation, technical analysis and risk. The results are organized into Daily, Swing and Position research to help users explore stocks according to their intended holding period.
33. How do I know if a stock is undervalued?
A stock may be considered undervalued when its market price is below an estimate of its underlying or intrinsic value. Investors can use methods such as discounted cash flow (DCF), earnings multiples and other valuation techniques to estimate potential fair value.
However, an estimated fair value is not a guarantee that the market price will eventually reach that value.
How IM-AAM can help: IM-AAM incorporates DCF-based valuation into its stock-analysis process to estimate a potential fair-value range and compare it with the current market price, alongside other fundamental and technical factors.
34. What is a good stock analysis method?
A comprehensive stock analysis can combine several approaches rather than relying on a single indicator. Fundamental analysis examines the company’s financial and business characteristics, valuation estimates what the stock may be worth, and technical analysis examines price, volume and market trends.
Different methods can produce different conclusions, so investors should also consider uncertainty and risk.
How IM-AAM can help: IM-AAM combines fundamental analysis, valuation, technical analysis and risk analysis into its stock research process, allowing users to examine potential opportunities from multiple perspectives.
35. How much money do I need to start investing?
There is no universal minimum amount required to begin investing. The amount you need depends on the broker you use, the stocks you want to buy, transaction costs and whether fractional shares are available.
It is generally important to consider diversification and risk rather than investing more money than you can afford to lose.
How IM-AAM can help: IM-AAM’s portfolio tools can help users analyze portfolio allocation and diversification, regardless of whether they are researching a small or larger portfolio.
36. How do I find stocks with growth potential?
Investors commonly examine revenue and earnings growth, profitability, competitive advantages, industry conditions, company fundamentals, valuation and market trends when researching growth potential.
Strong historical growth does not guarantee future performance, so valuation and risk should also be considered.
How IM-AAM can help: IM-AAM combines fundamental factors, valuation and technical analysis to help users research companies with different characteristics rather than relying solely on historical growth.
37. How do I reduce risk when investing in stocks?
Risk cannot be completely eliminated when investing in stocks. Investors can manage risk through diversification, appropriate position sizing, understanding the companies they invest in, considering valuation and avoiding excessive concentration in a single stock or sector.
How IM-AAM can help: IM-AAM provides portfolio analysis tools that can help users examine diversification across factors such as sectors, market capitalization and investment strategies.
38. What is DCF valuation?
Discounted Cash Flow (DCF) valuation is a method used to estimate the present value of a company’s expected future cash flows. Future cash flows are discounted back to their present value using a discount rate.
DCF is widely used in financial analysis, but the result depends on assumptions such as future growth, cash flows, discount rates and terminal value.
How IM-AAM uses DCF: IM-AAM incorporates DCF-based valuation into its stock-analysis process to estimate potential fair value and compare it with the current market price. DCF is considered alongside other analytical factors rather than being treated as a guarantee of future performance.
39. How do I calculate the fair value of a stock?
There are several approaches to estimating a stock’s fair value, including DCF valuation, earnings multiples, comparable-company analysis and other valuation methods.
A DCF model generally estimates future cash flows and discounts them to their present value. Because the calculation depends on assumptions about the future, different assumptions can produce different fair-value estimates.
How IM-AAM can help: IM-AAM uses DCF-based analysis to estimate a potential fair-value range for stocks and compares the estimated value with the market price as part of its broader stock-analysis process.
40. How do I find undervalued stocks?
One approach is to screen for companies whose market prices appear low relative to an estimate of their intrinsic or fair value. Investors may combine valuation metrics such as DCF with fundamental quality, earnings, financial strength and technical conditions.
A stock can appear undervalued for many reasons, and an apparent valuation gap does not guarantee that the price will increase.
How IM-AAM can help: IM-AAM’s stock research combines valuation with fundamental and technical analysis to help users investigate potential undervaluation rather than relying on price-to-value comparisons alone.
41. What does intrinsic value mean?
Intrinsic value is an estimate of what an asset may be worth based on its underlying characteristics rather than simply its current market price.
For a company, intrinsic value may be estimated using factors such as expected future cash flows, earnings, growth and risk. Different valuation models and assumptions can produce different estimates.
How IM-AAM uses intrinsic value: IM-AAM uses DCF-based valuation to estimate potential fair value and compare it with the current market price as one component of its stock-analysis process.
42. How accurate is DCF valuation?
DCF valuation is an analytical estimate, not a prediction with guaranteed accuracy. Its result depends heavily on assumptions about future cash flows, growth rates, discount rates and terminal value.
Small changes in assumptions can produce significantly different valuations. For this reason, DCF is generally more useful when combined with other forms of analysis and risk assessment.
How IM-AAM uses DCF: IM-AAM treats DCF as one component of a broader stock-analysis framework, combining valuation with fundamental, technical and risk-related factors.
43. How do I identify stock support and resistance?
Support is generally a price area where buying interest has historically helped prevent or slow further declines. Resistance is generally a price area where selling pressure has historically limited or slowed further increases.
Support and resistance are not guaranteed price levels. They can break when market conditions change.
How IM-AAM uses support and resistance: IM-AAM incorporates technical analysis, including price trends and support/resistance conditions, when evaluating potential stock setups.
44. What does RSI mean?
RSI, or Relative Strength Index, is a momentum indicator commonly used in technical analysis. It measures the magnitude of recent price movements on a scale from 0 to 100.
RSI is often used to identify periods of relatively strong or weak momentum. However, an RSI reading by itself does not determine whether a stock should be bought or sold.
How IM-AAM uses RSI: RSI is one of the technical indicators that can be considered within IM-AAM’s broader technical-analysis process rather than being used as a standalone signal.
45. How can I identify a bullish trend?
A bullish trend generally refers to a period in which prices are moving upward, often characterized by a series of higher highs and higher lows. Investors may also examine moving averages, momentum, volume and other technical indicators.
A bullish trend does not guarantee that prices will continue rising.
How IM-AAM uses trend analysis: IM-AAM incorporates price trends and technical indicators into its stock-analysis process and combines them with fundamental and valuation information.
46. How does technical analysis work?
Technical analysis studies historical price and volume data to identify trends, momentum, support and resistance, and other market patterns.
Common tools include moving averages, RSI, volume analysis, trendlines and support/resistance levels.
Technical analysis can provide information about market behavior, but it cannot guarantee future price movements.
How IM-AAM uses technical analysis: IM-AAM combines technical analysis with fundamental analysis, valuation and risk factors so that users can examine stocks from multiple perspectives.
47. How many stocks should I own?
There is no universal number of stocks that is appropriate for every investor. The appropriate level of diversification depends on factors such as portfolio size, risk tolerance, investment objectives, sectors, companies and correlations between holdings.
Owning more stocks does not automatically eliminate risk, while owning too few can increase concentration risk.
How IM-AAM can help: IM-AAM’s portfolio analysis tools can help users examine diversification across sectors, market capitalization and different investment strategies.
48. How do I diversify a stock portfolio?
Diversification generally involves spreading investments across different companies, sectors, industries, market capitalizations or other assets rather than concentrating a portfolio in a small number of positions.
The objective is to reduce the impact that a single investment or category can have on the overall portfolio.
How IM-AAM can help: IM-AAM provides portfolio analysis that can help users examine their exposure across sectors, market capitalization and investment strategies.
49. What is portfolio diversification?
Portfolio diversification means spreading investments across different holdings or categories so that the portfolio is not overly dependent on the performance of one investment.
Diversification can reduce concentration risk, although it cannot eliminate overall investment risk.
How IM-AAM can help: IM-AAM’s My Portfolio tools help users examine portfolio composition and diversification across multiple dimensions, including sector, market capitalization and strategy.
50. How should I allocate my portfolio?
There is no single portfolio allocation that is appropriate for everyone. Allocation decisions can depend on investment objectives, time horizon, risk tolerance, portfolio size and the characteristics of the investments being considered.
Investors can evaluate how different allocations affect expected return, volatility, diversification and concentration.
How IM-AAM can help: IM-AAM’s portfolio analytics include portfolio allocation and efficient-frontier analysis, helping users examine the relationship between portfolio risk and potential return.
51. What is the efficient frontier?
The efficient frontier is a concept from modern portfolio theory that represents portfolios offering the highest expected return for a given level of risk, or the lowest expected risk for a given level of expected return, based on the assumptions and inputs used in the model.
It is a mathematical portfolio-optimization framework rather than a guarantee of future performance.
How IM-AAM uses the efficient frontier: IM-AAM’s portfolio tools can use efficient-frontier analysis to help users examine how different portfolio weights can affect the relationship between expected return and portfolio risk.